library(comexr)
library(dplyr)
#>
#> Attaching package: 'dplyr'
#> The following objects are masked from 'package:stats':
#>
#>     filter, lag
#> The following objects are masked from 'package:base':
#>
#>     intersect, setdiff, setequal, union
library(ggplot2)
library(slider)
if (params$download) {
  try({comex_download(years = 2009:2024, types = "ncm"
                      , ssl_verifypeer=FALSE ## might need this for Brazilian gov websites
                   )})
}
library(lubridate) ## needs to import for slide_index_dbl to work
#>
#> Attaching package: 'lubridate'
#> The following objects are masked from 'package:base':
#>
#>     date, intersect, setdiff, union
cars_roll <- cars|>
  group_by(direction, china)|>
  comex_roll()
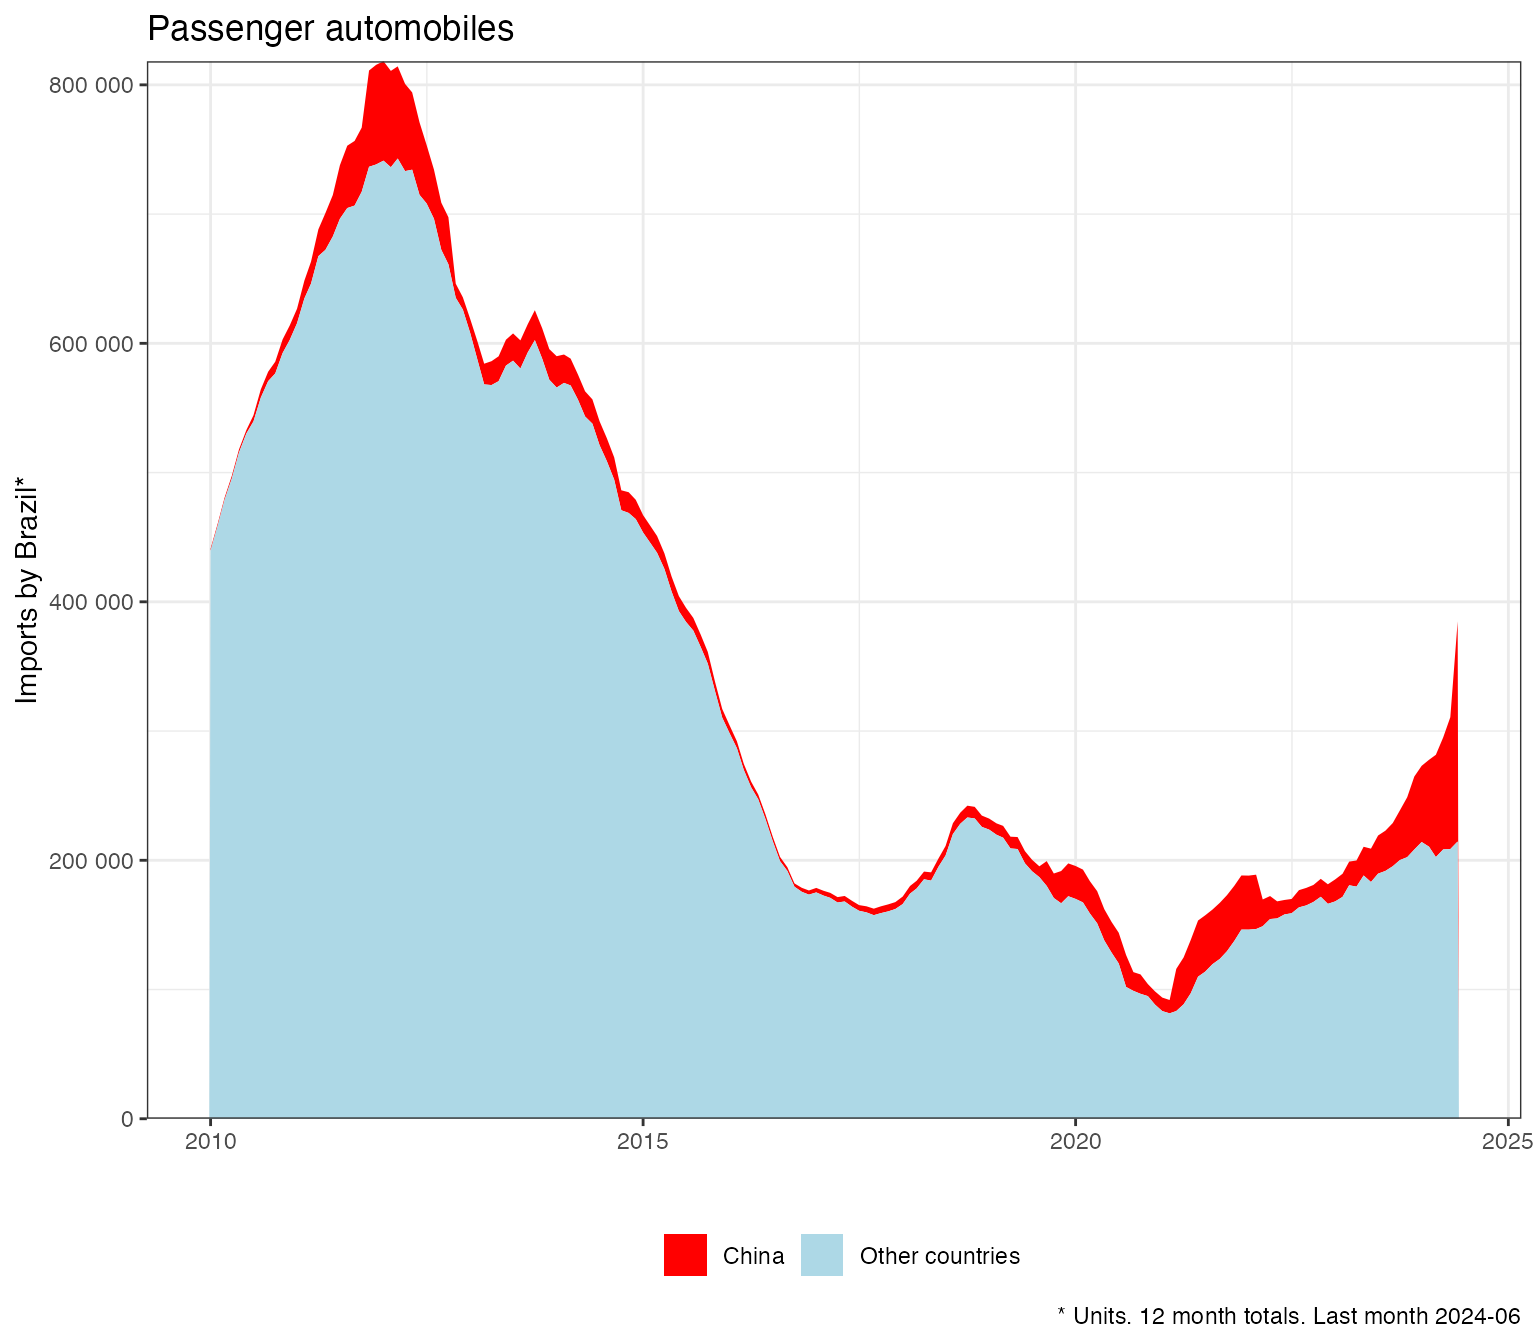
ggplot(aes(x=date,y=qt_stat_12,
           , fill = china
), data=
  cars_roll%>%
  mutate(china=if_else(china, "China", "Other countries"))%>%
  filter(date>="2010-01-01",
         direction=="imp",
         !is.na(qt_stat_12))) +
  scale_y_continuous(labels=scales::label_number_auto(), limits=c(0,NA), expand = c(0,0))+
  geom_area() +
  scale_fill_manual(values = c("red", "lightblue"))+
  labs(x="", y="Imports by Brazil*", caption=glue::glue("* Units. 12 month totals. Last month {max(substr(cars_roll$date,1,7))}"), fill="", title="Passenger automobiles", linetype="") +
  theme_bw()+theme(legend.position="bottom")
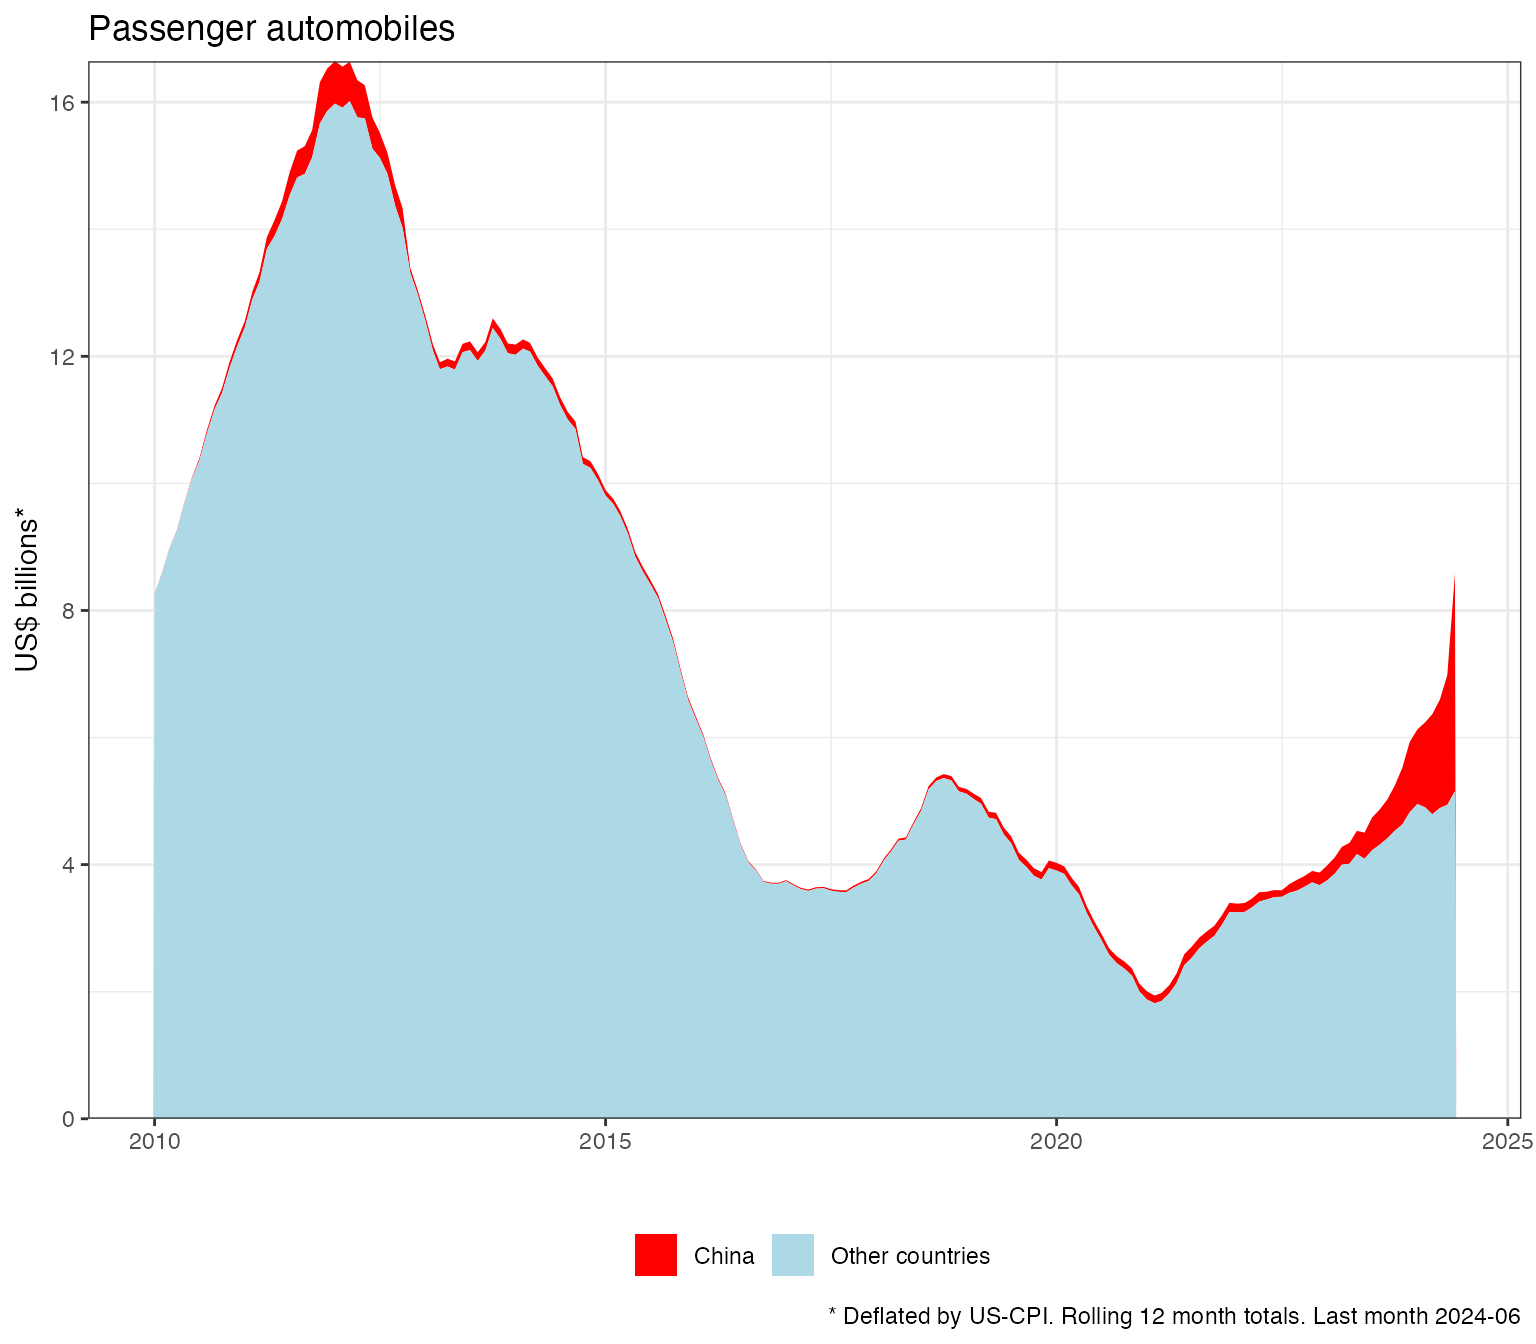
ggplot(aes(x=date,y=fob_usd_deflated_12/1e9,
           , fill = china
), data=
  cars_deflated%>%
  mutate(china=if_else(china, "China", "Other countries"))
  ) +
  scale_y_continuous(labels=scales::label_number_auto(), limits=c(0,NA), expand = c(0,0))+
  geom_area() +
  scale_fill_manual(values = c("red", "lightblue"))+
  labs(x="", y="US$ billions*",
       caption=glue::glue("* Deflated by US-CPI. Rolling 12 month totals. Last month {max(substr(cars_deflated$date,1,7))}"), fill="", title="Passenger automobiles", linetype="") +
  theme_bw()+theme(legend.position="bottom")